
A tour of StaffMargin
StaffMargin has one layout everywhere: a sidebar on the left to move between sections, a top bar for search and quick actions, and the page itself in the middle. Learn those three and you can find anything. This tour walks through each, then shows you how to read the dashboard.
If you have not added any data yet, start with the quickstart. The tour reads better once you have a person, a client, and a project in place.
The sidebar
Section titled “The sidebar”The sidebar groups every page into four sections, following how the app fits together.
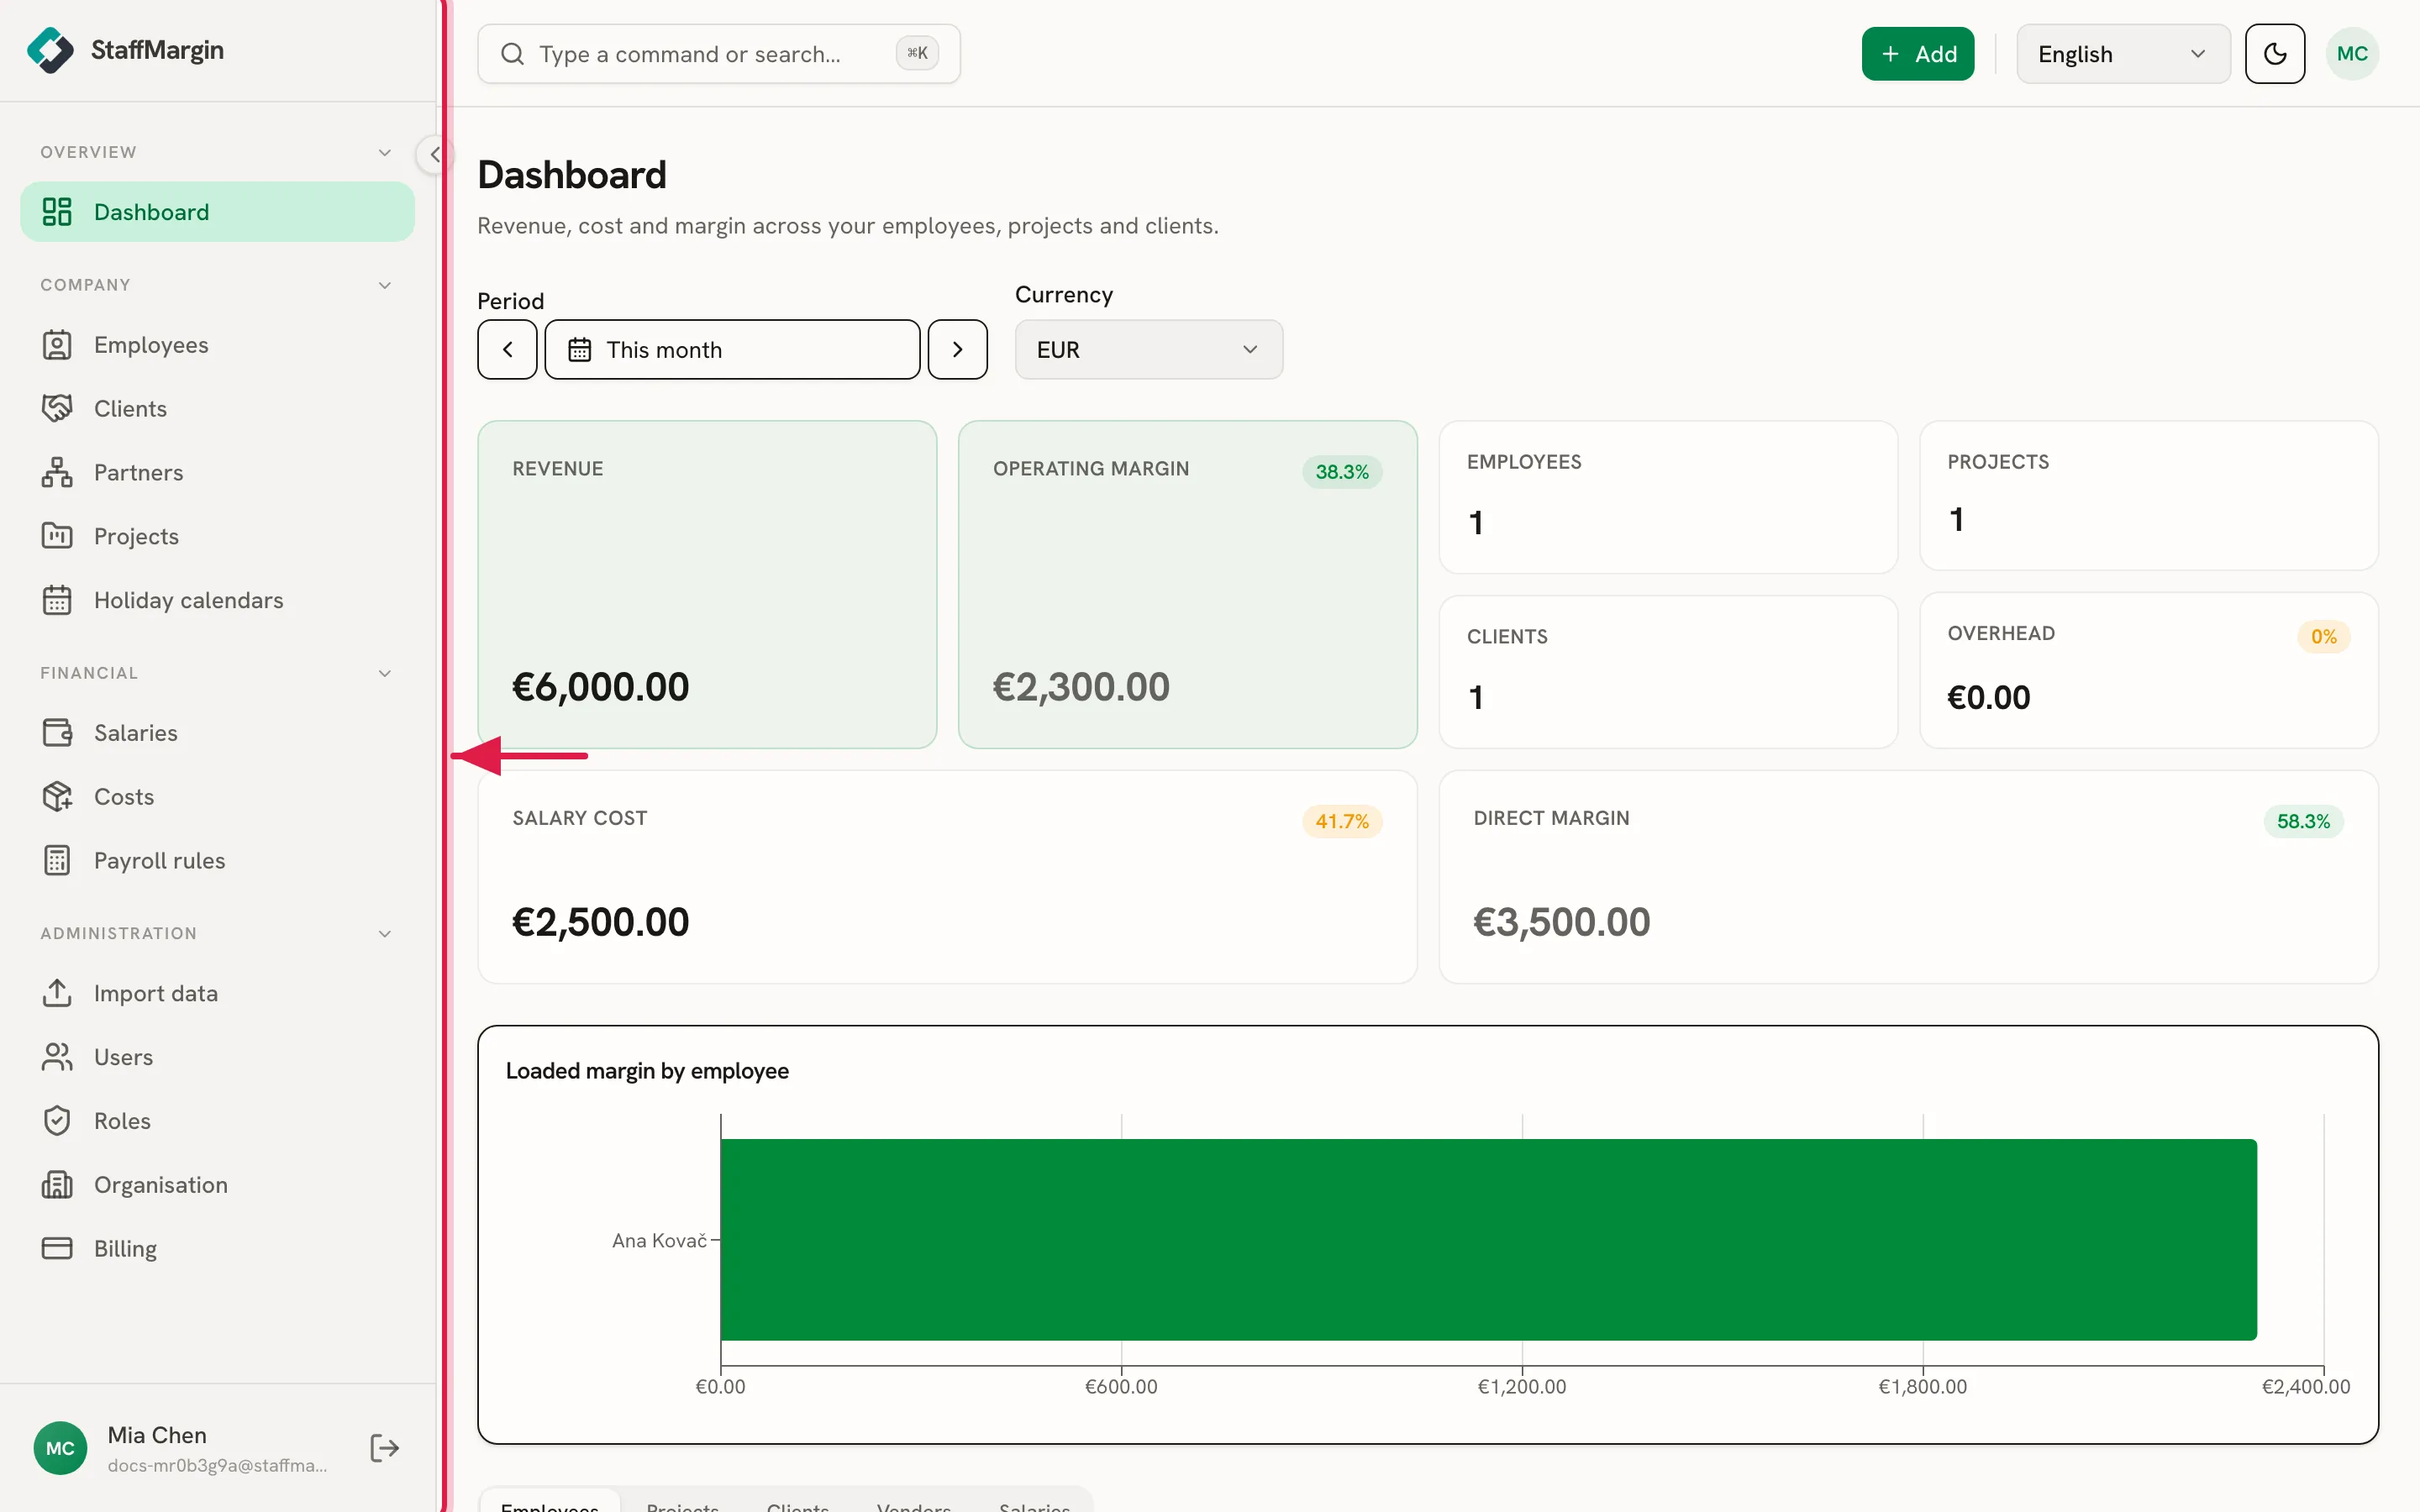
- Overview holds the Dashboard, your single view of revenue, cost, and margin.
- Company is who and what you bill: Employees, Clients, Partners, Projects, and Holiday calendars.
- Financial is the money behind each person: Salaries, Costs, and Payroll rules (the per-country employer-cost engine).
- Administration is the workspace itself: Import data, Users, Roles, Organisation, and Billing.
Your own profile sits at the bottom of the sidebar. Click your name to manage your profile or to sign out.
You may not see every page. StaffMargin hides what your role cannot open, and some pages depend on your plan. See roles and permissions for what controls visibility.
The top bar
Section titled “The top bar”The top bar is the same on every page. It has three things worth knowing.
Search anything
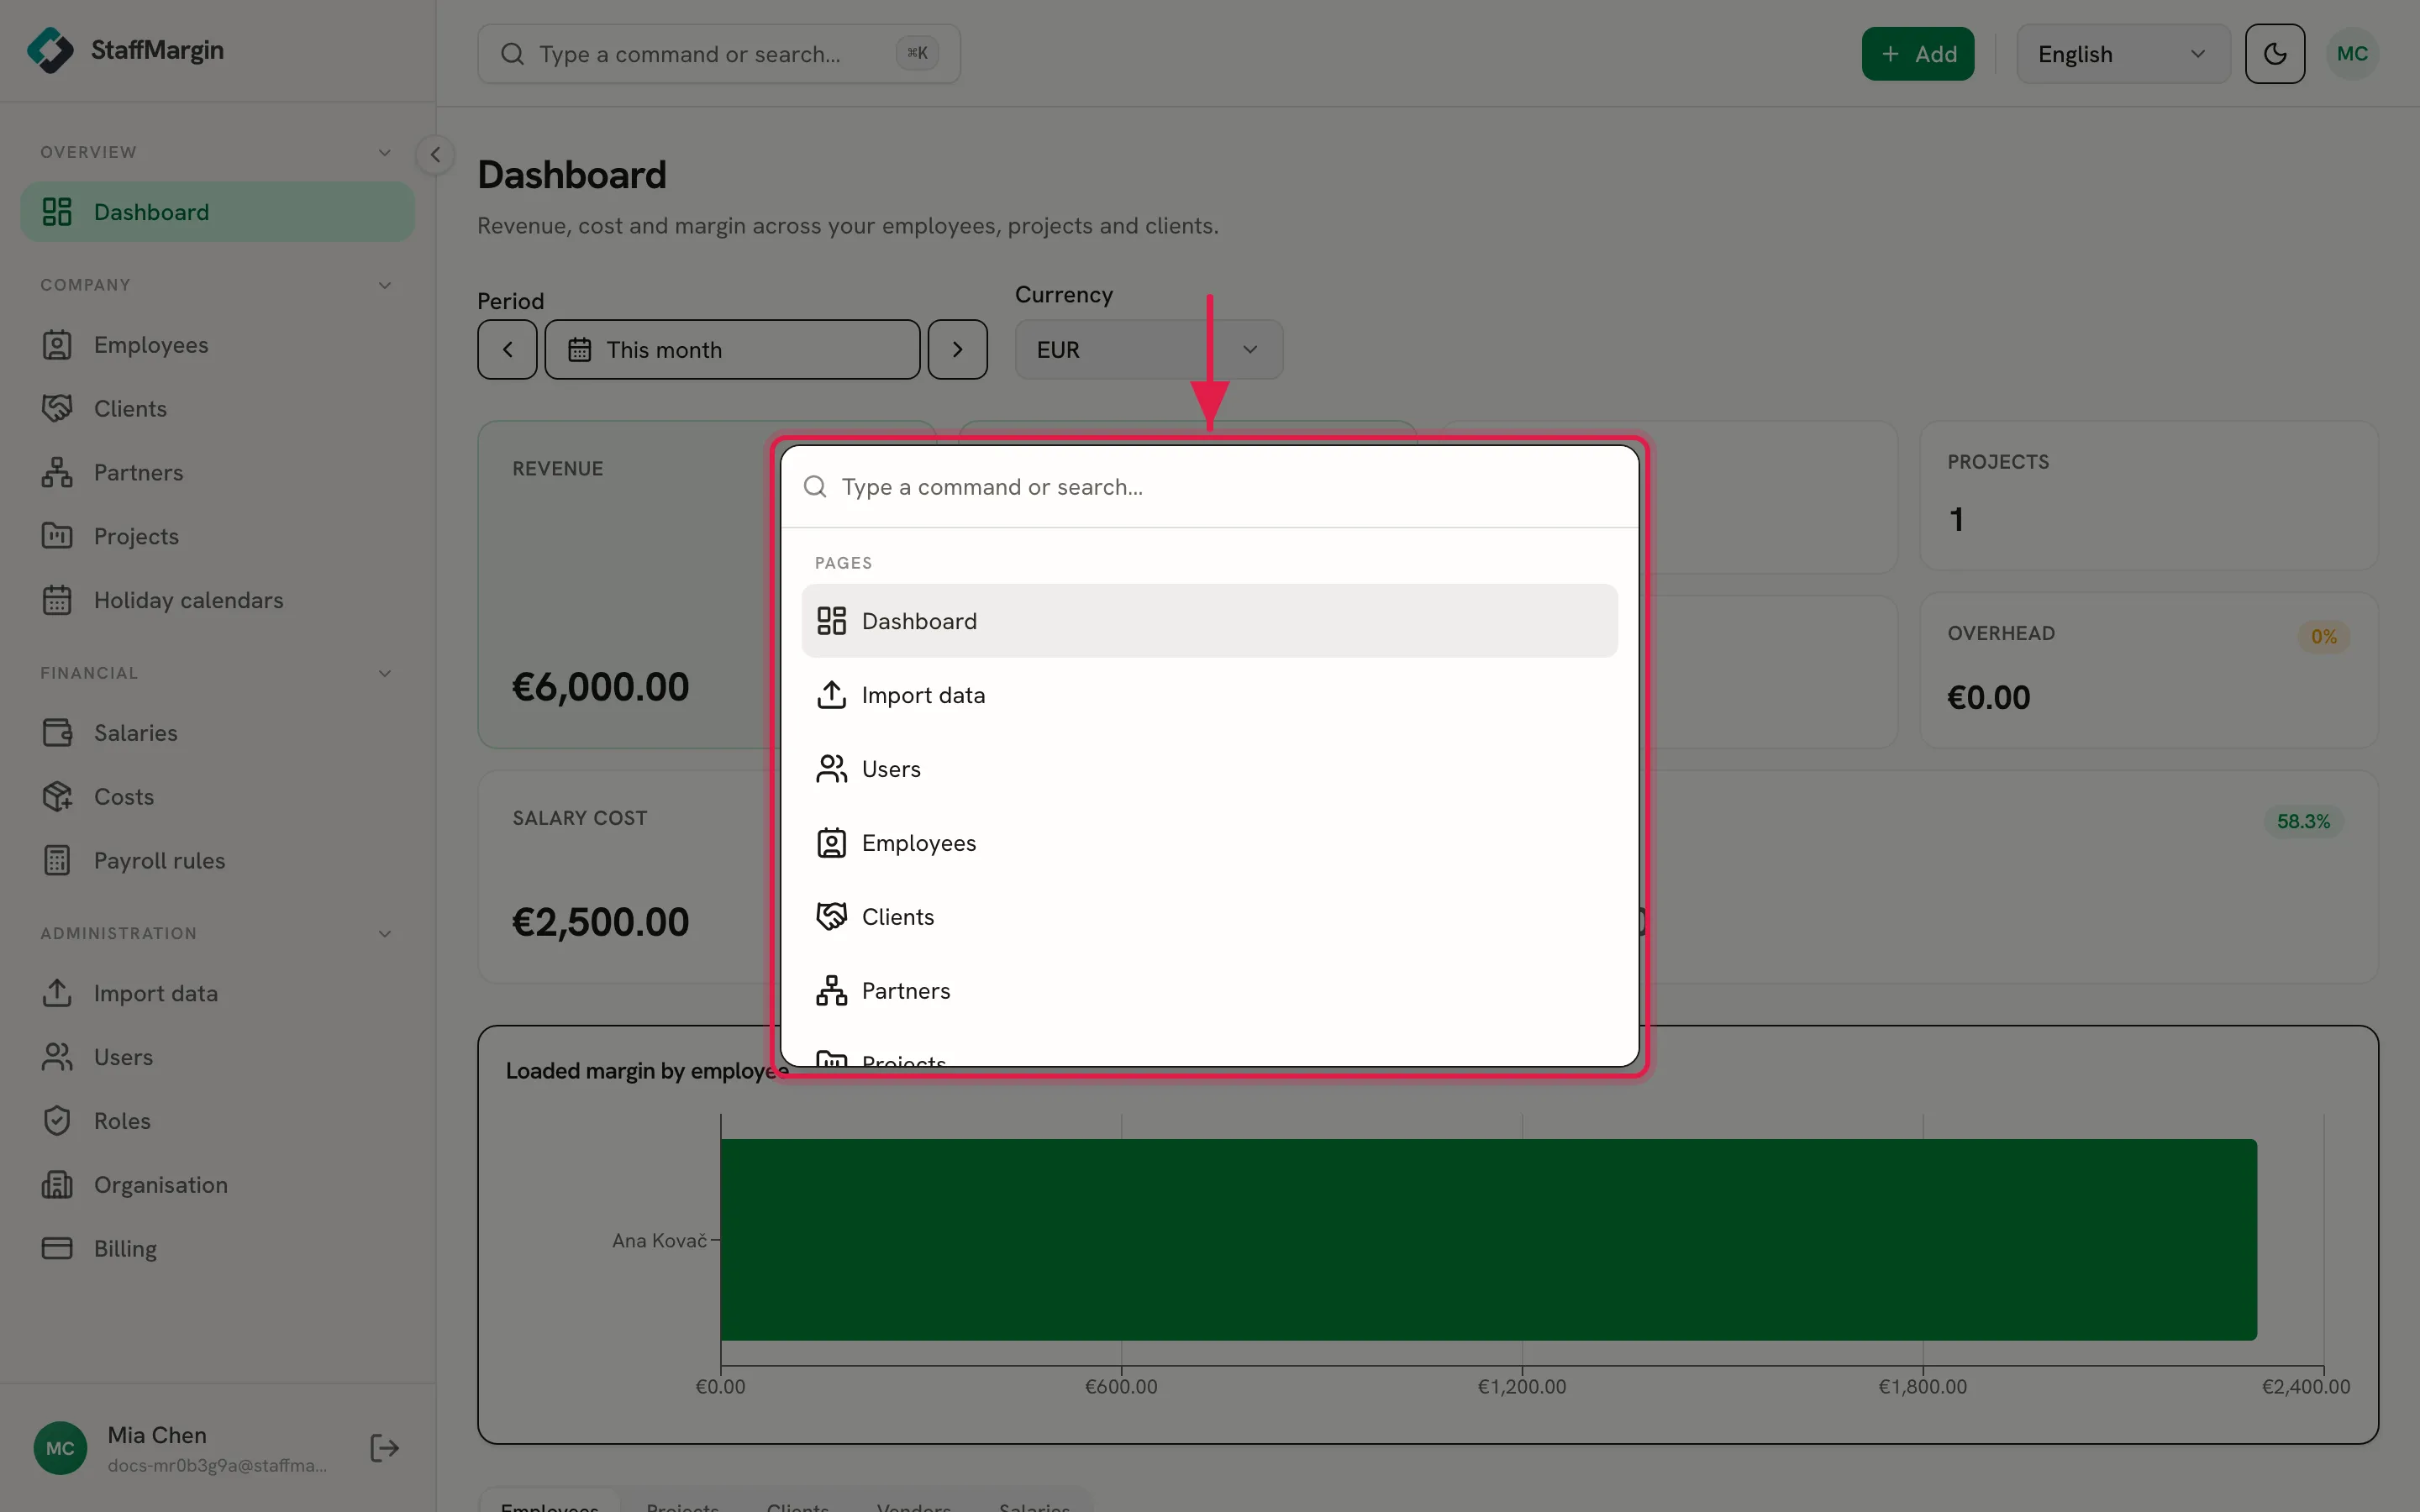
Section titled “Search anything”The search box on the left opens the command palette. Press Cmd+K (Ctrl+K on Windows) from anywhere, type a few letters, and jump straight to a page or an action.
Add anything
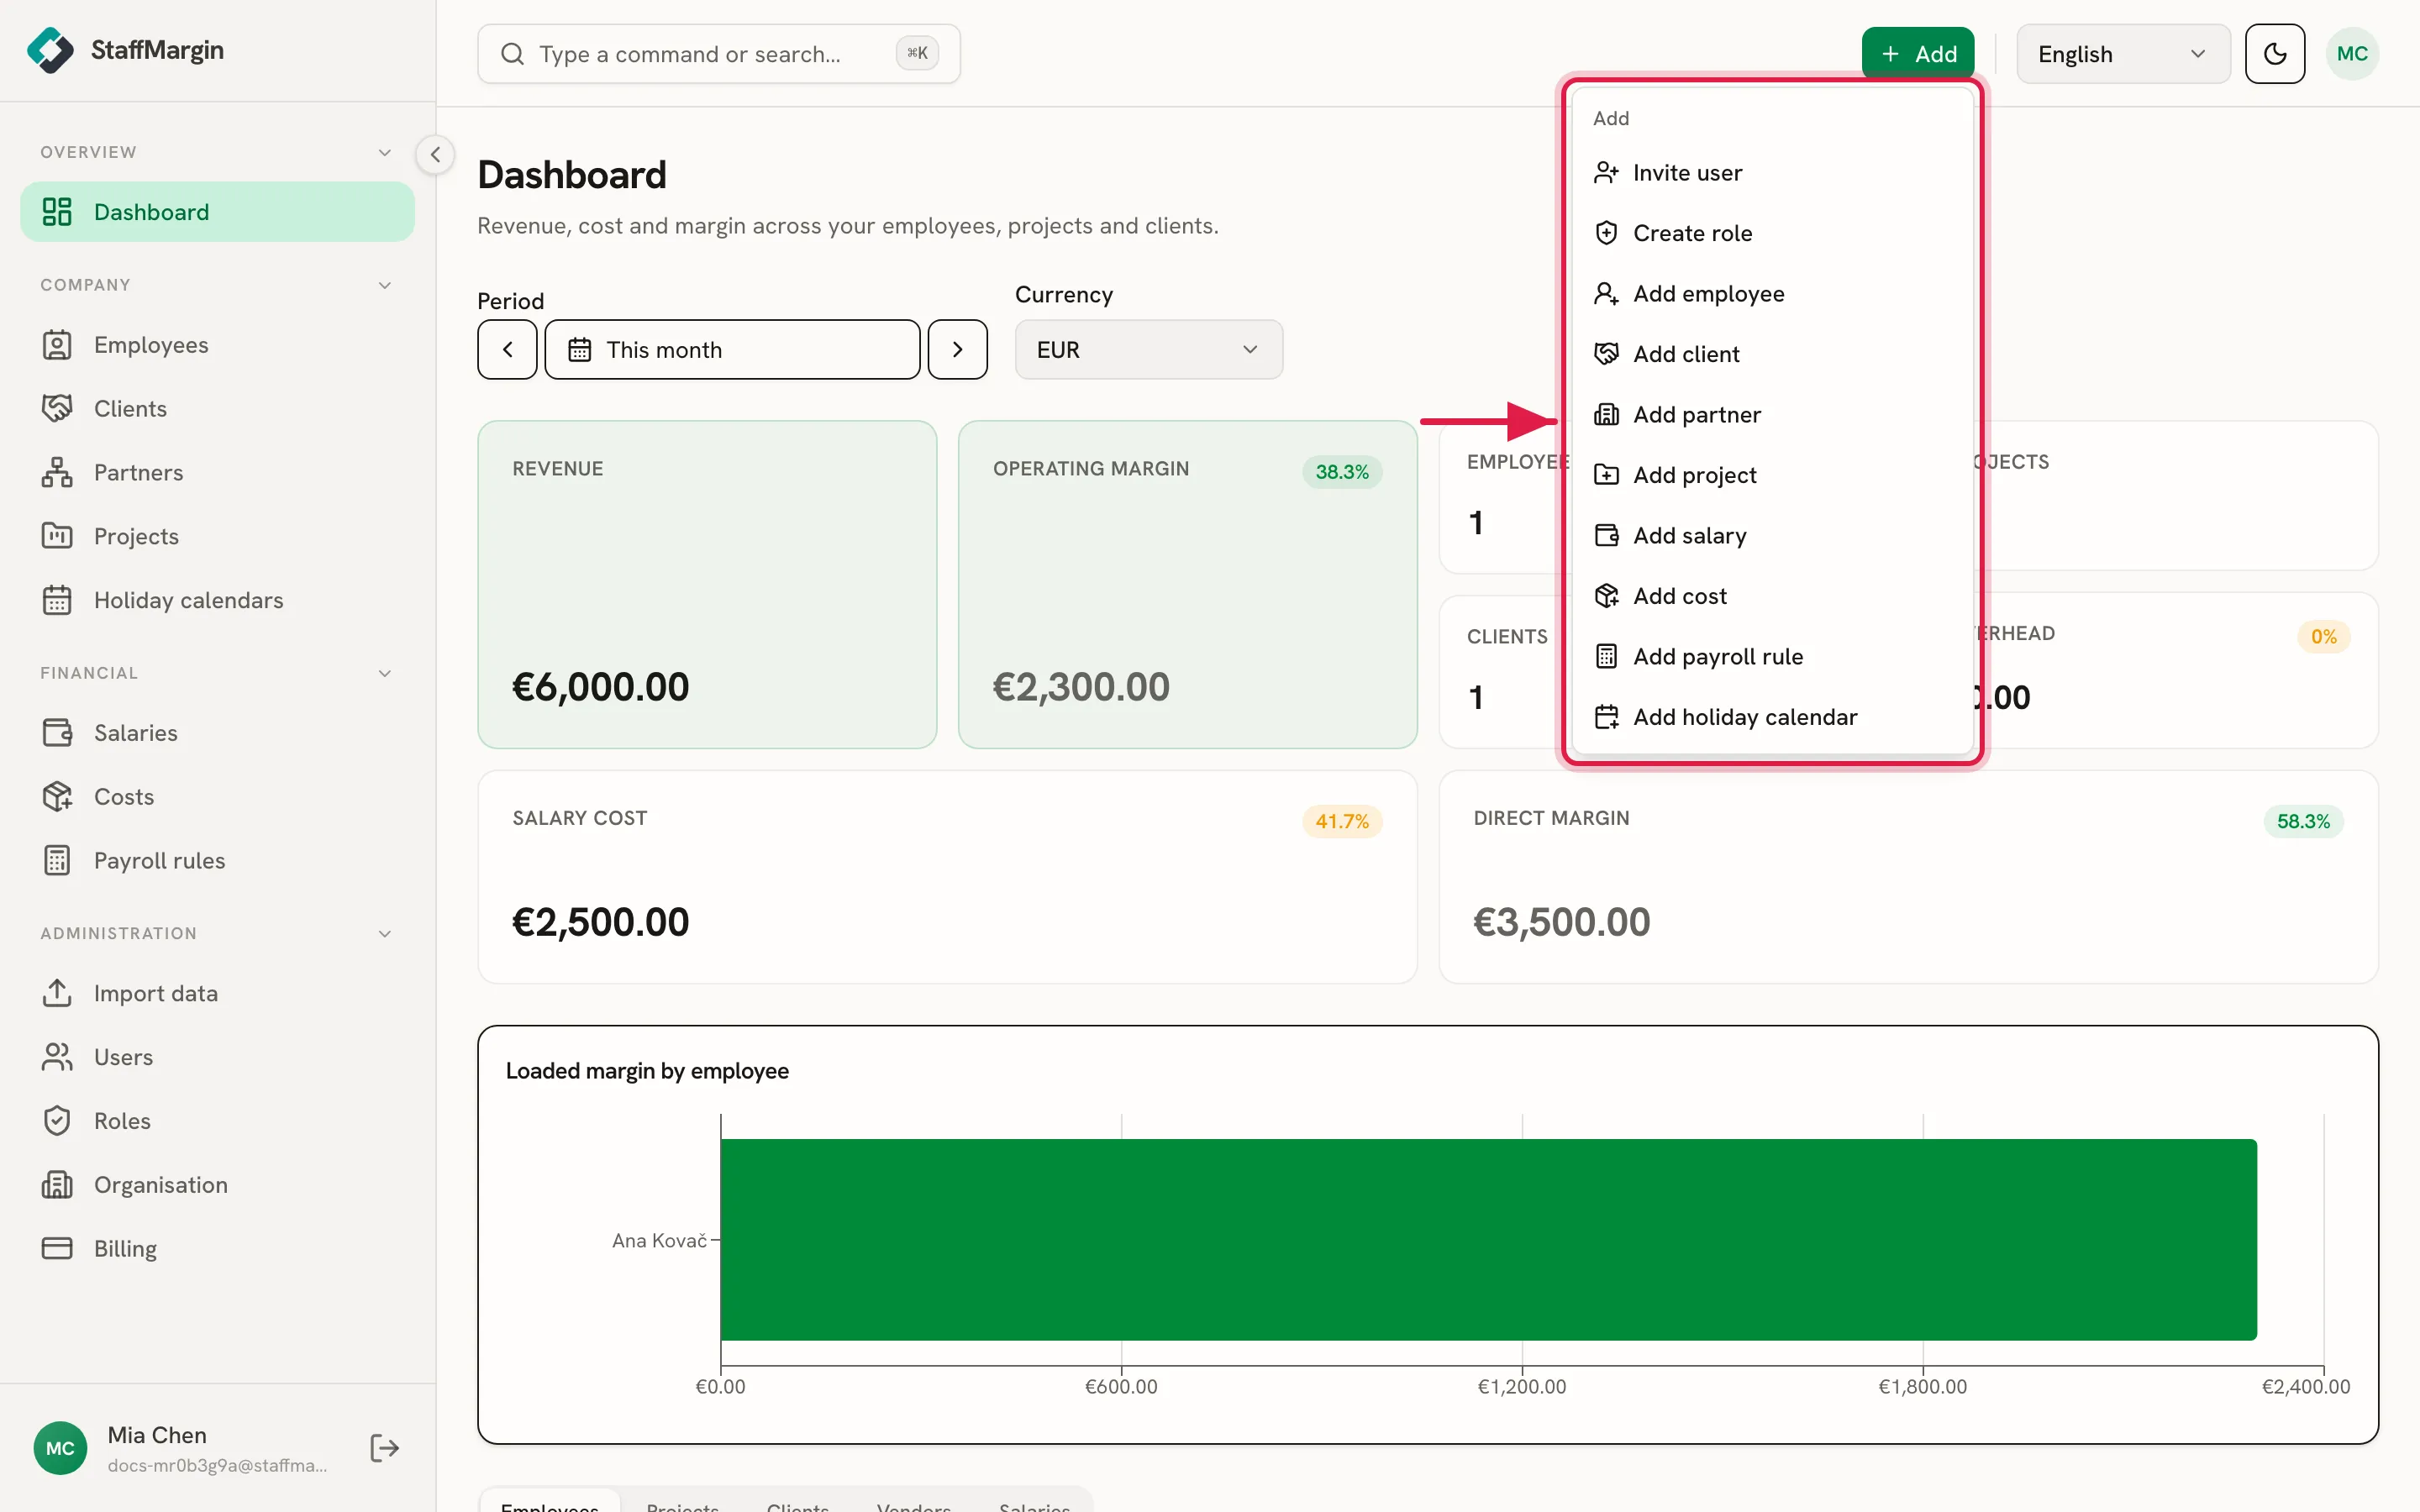
Section titled “Add anything”The green + Add button on the right is the quick-add launcher. It lists the things you can create, like an employee, a client, or a cost, without leaving the page you are on.
The far right of the top bar holds your language switch, the light and dark theme toggle, and your account avatar.
Your dashboard
Section titled “Your dashboard”The Dashboard is where the numbers come together. Set the period and the reporting currency at the top, then read the result.
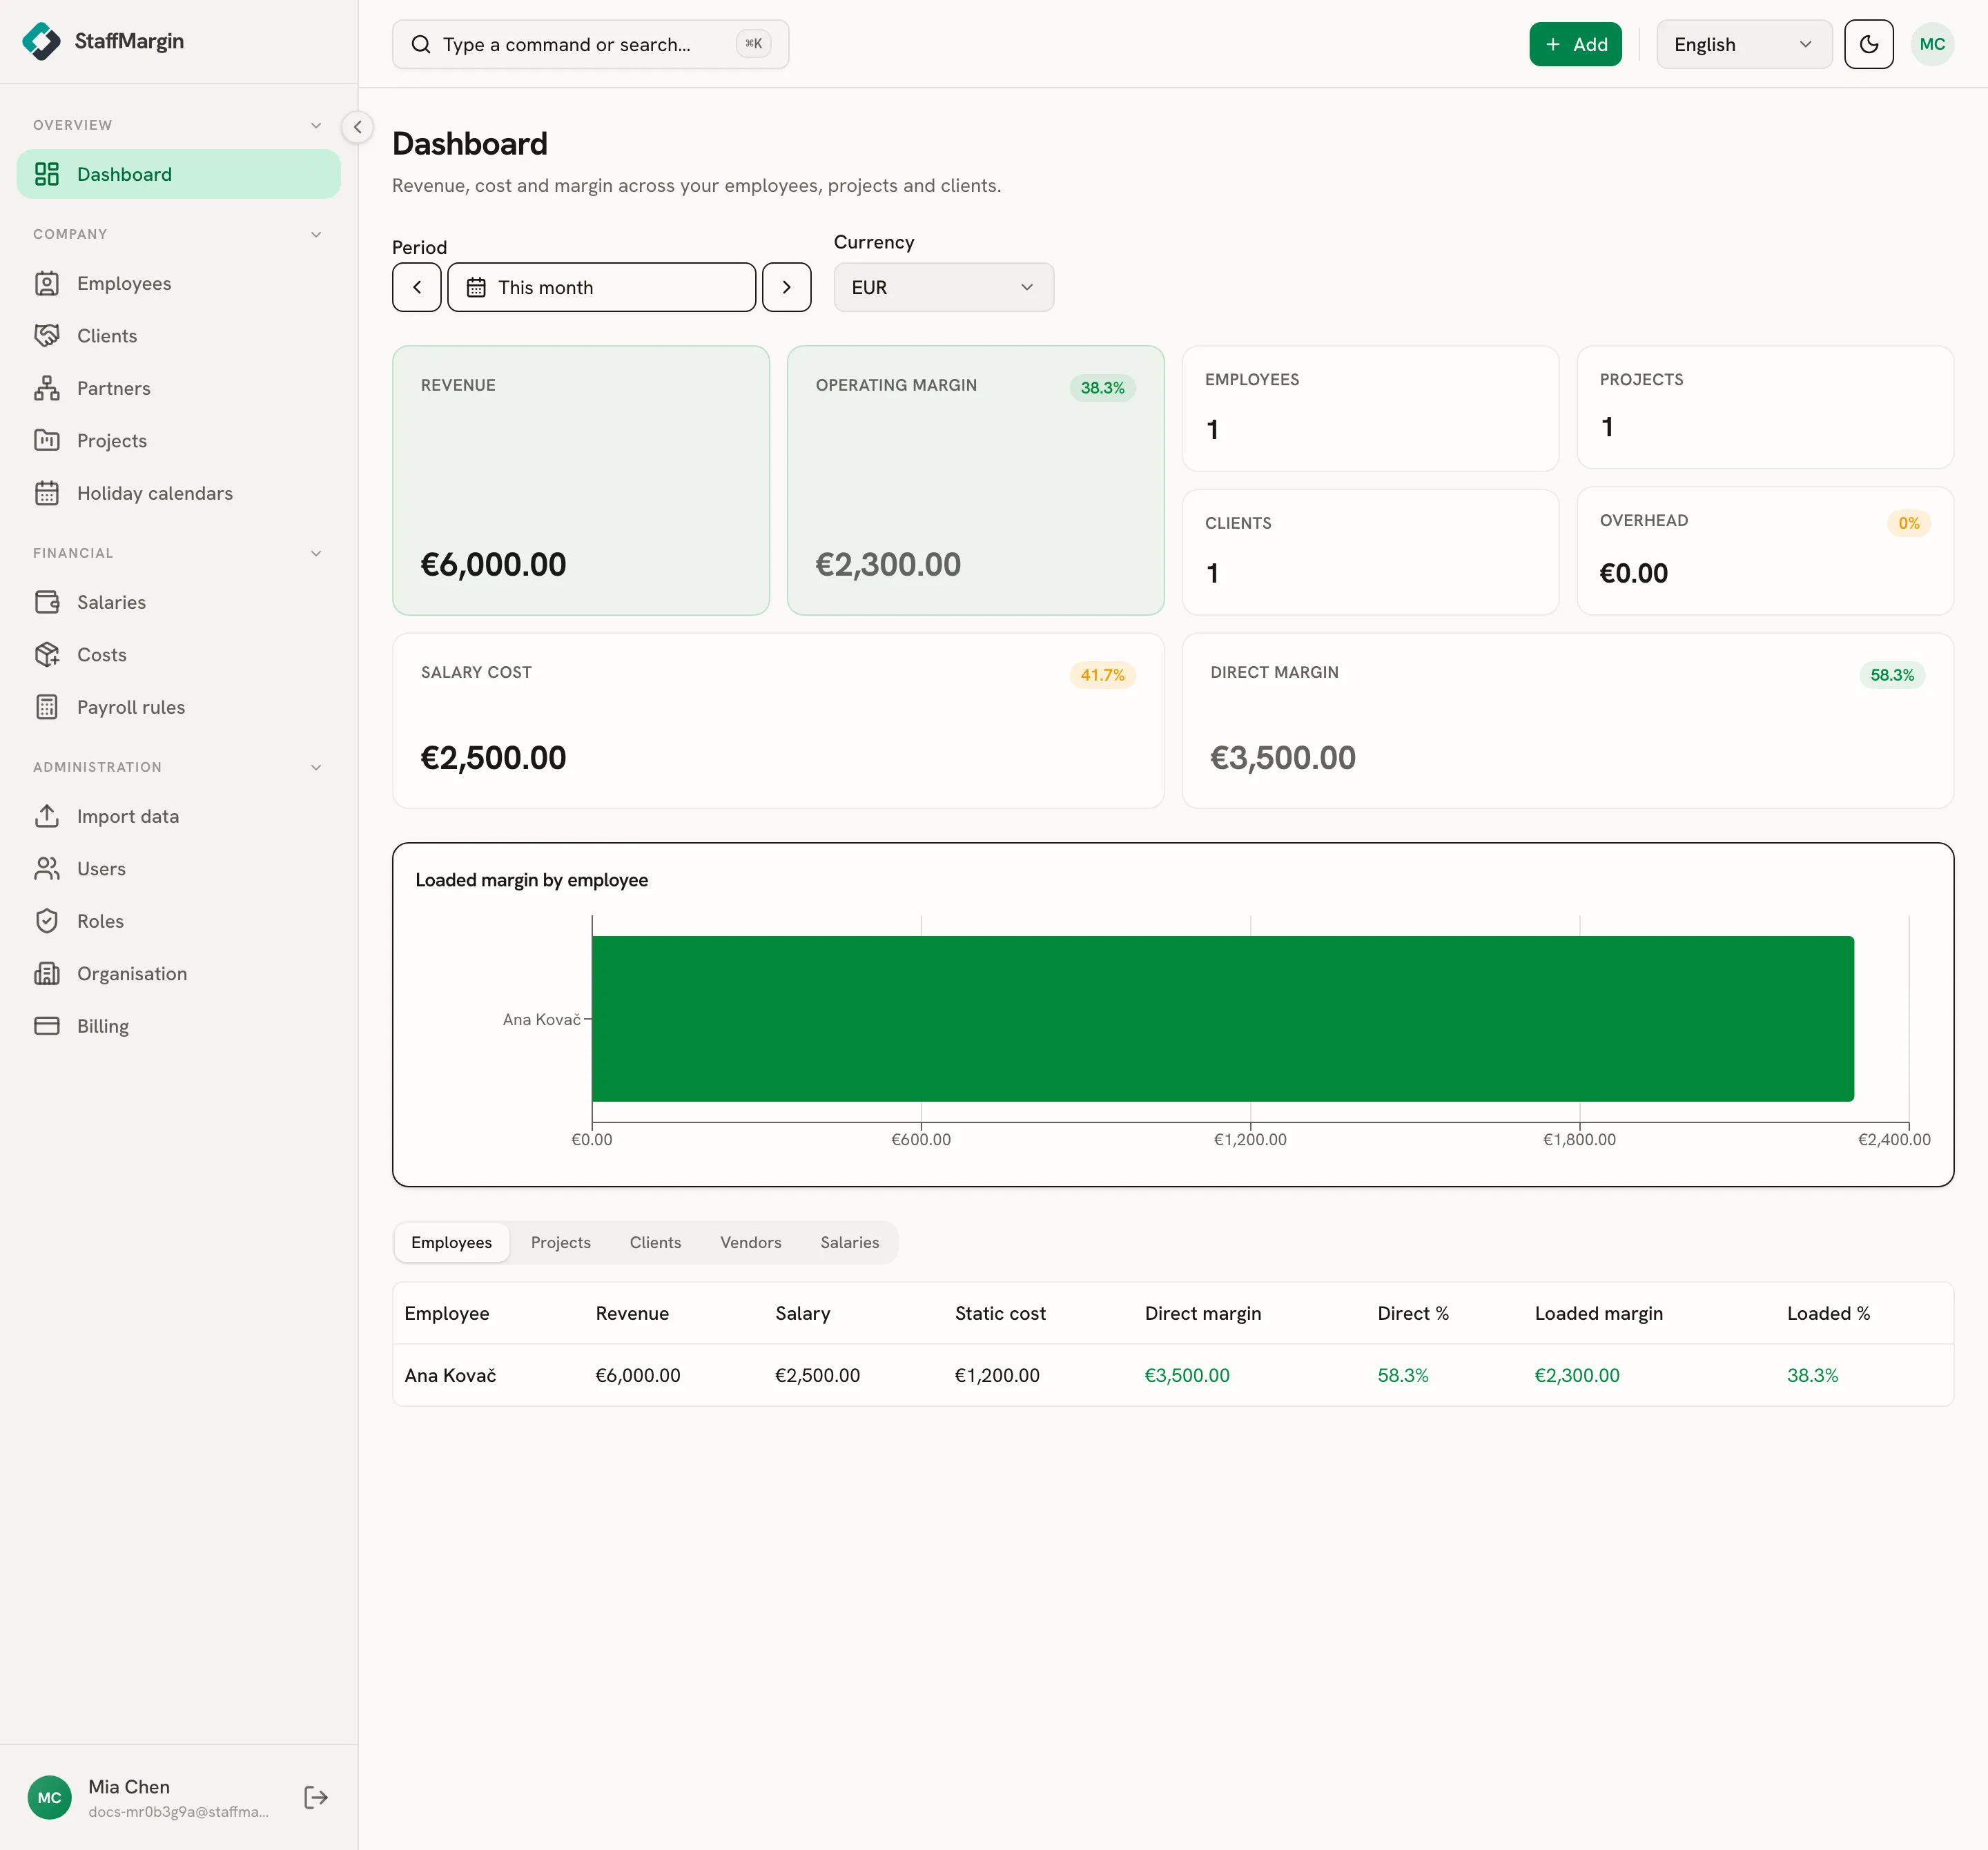
The summary cards show revenue, operating margin, salary cost, and direct margin for the period. The chart below ranks loaded margin by employee. Under that, a switcher moves the same view between employees, projects, clients, vendors, and salaries, so you can see margin from whichever angle you need. Click any employee row to open that person’s detail.
Everything on the dashboard is billing minus loaded cost. If a number looks off, it usually traces back to a missing salary or an unallocated cost. See how margin is calculated.
Get around fast
Section titled “Get around fast”Two habits make the app quick:
- Press
Cmd+Kto search instead of hunting through the sidebar. - Use + Add to create from anywhere, then carry on with what you were doing.
When you have a lot to load at once, skip the forms and use import data to bring in employees, clients, projects, costs, and salaries from CSV.
Related
Section titled “Related”FAQ
How do I search in StaffMargin?
Cmd+K (Ctrl+K on Windows), or click the search box in the top bar. Type a few letters to jump to a page or a create action.