
Your dashboard
The Dashboard is your margin in one view. It pulls together revenue, cost, and margin for a period and a single reporting currency, so you can see what you keep without opening a spreadsheet. This page explains every field on it.
What’s on the dashboard
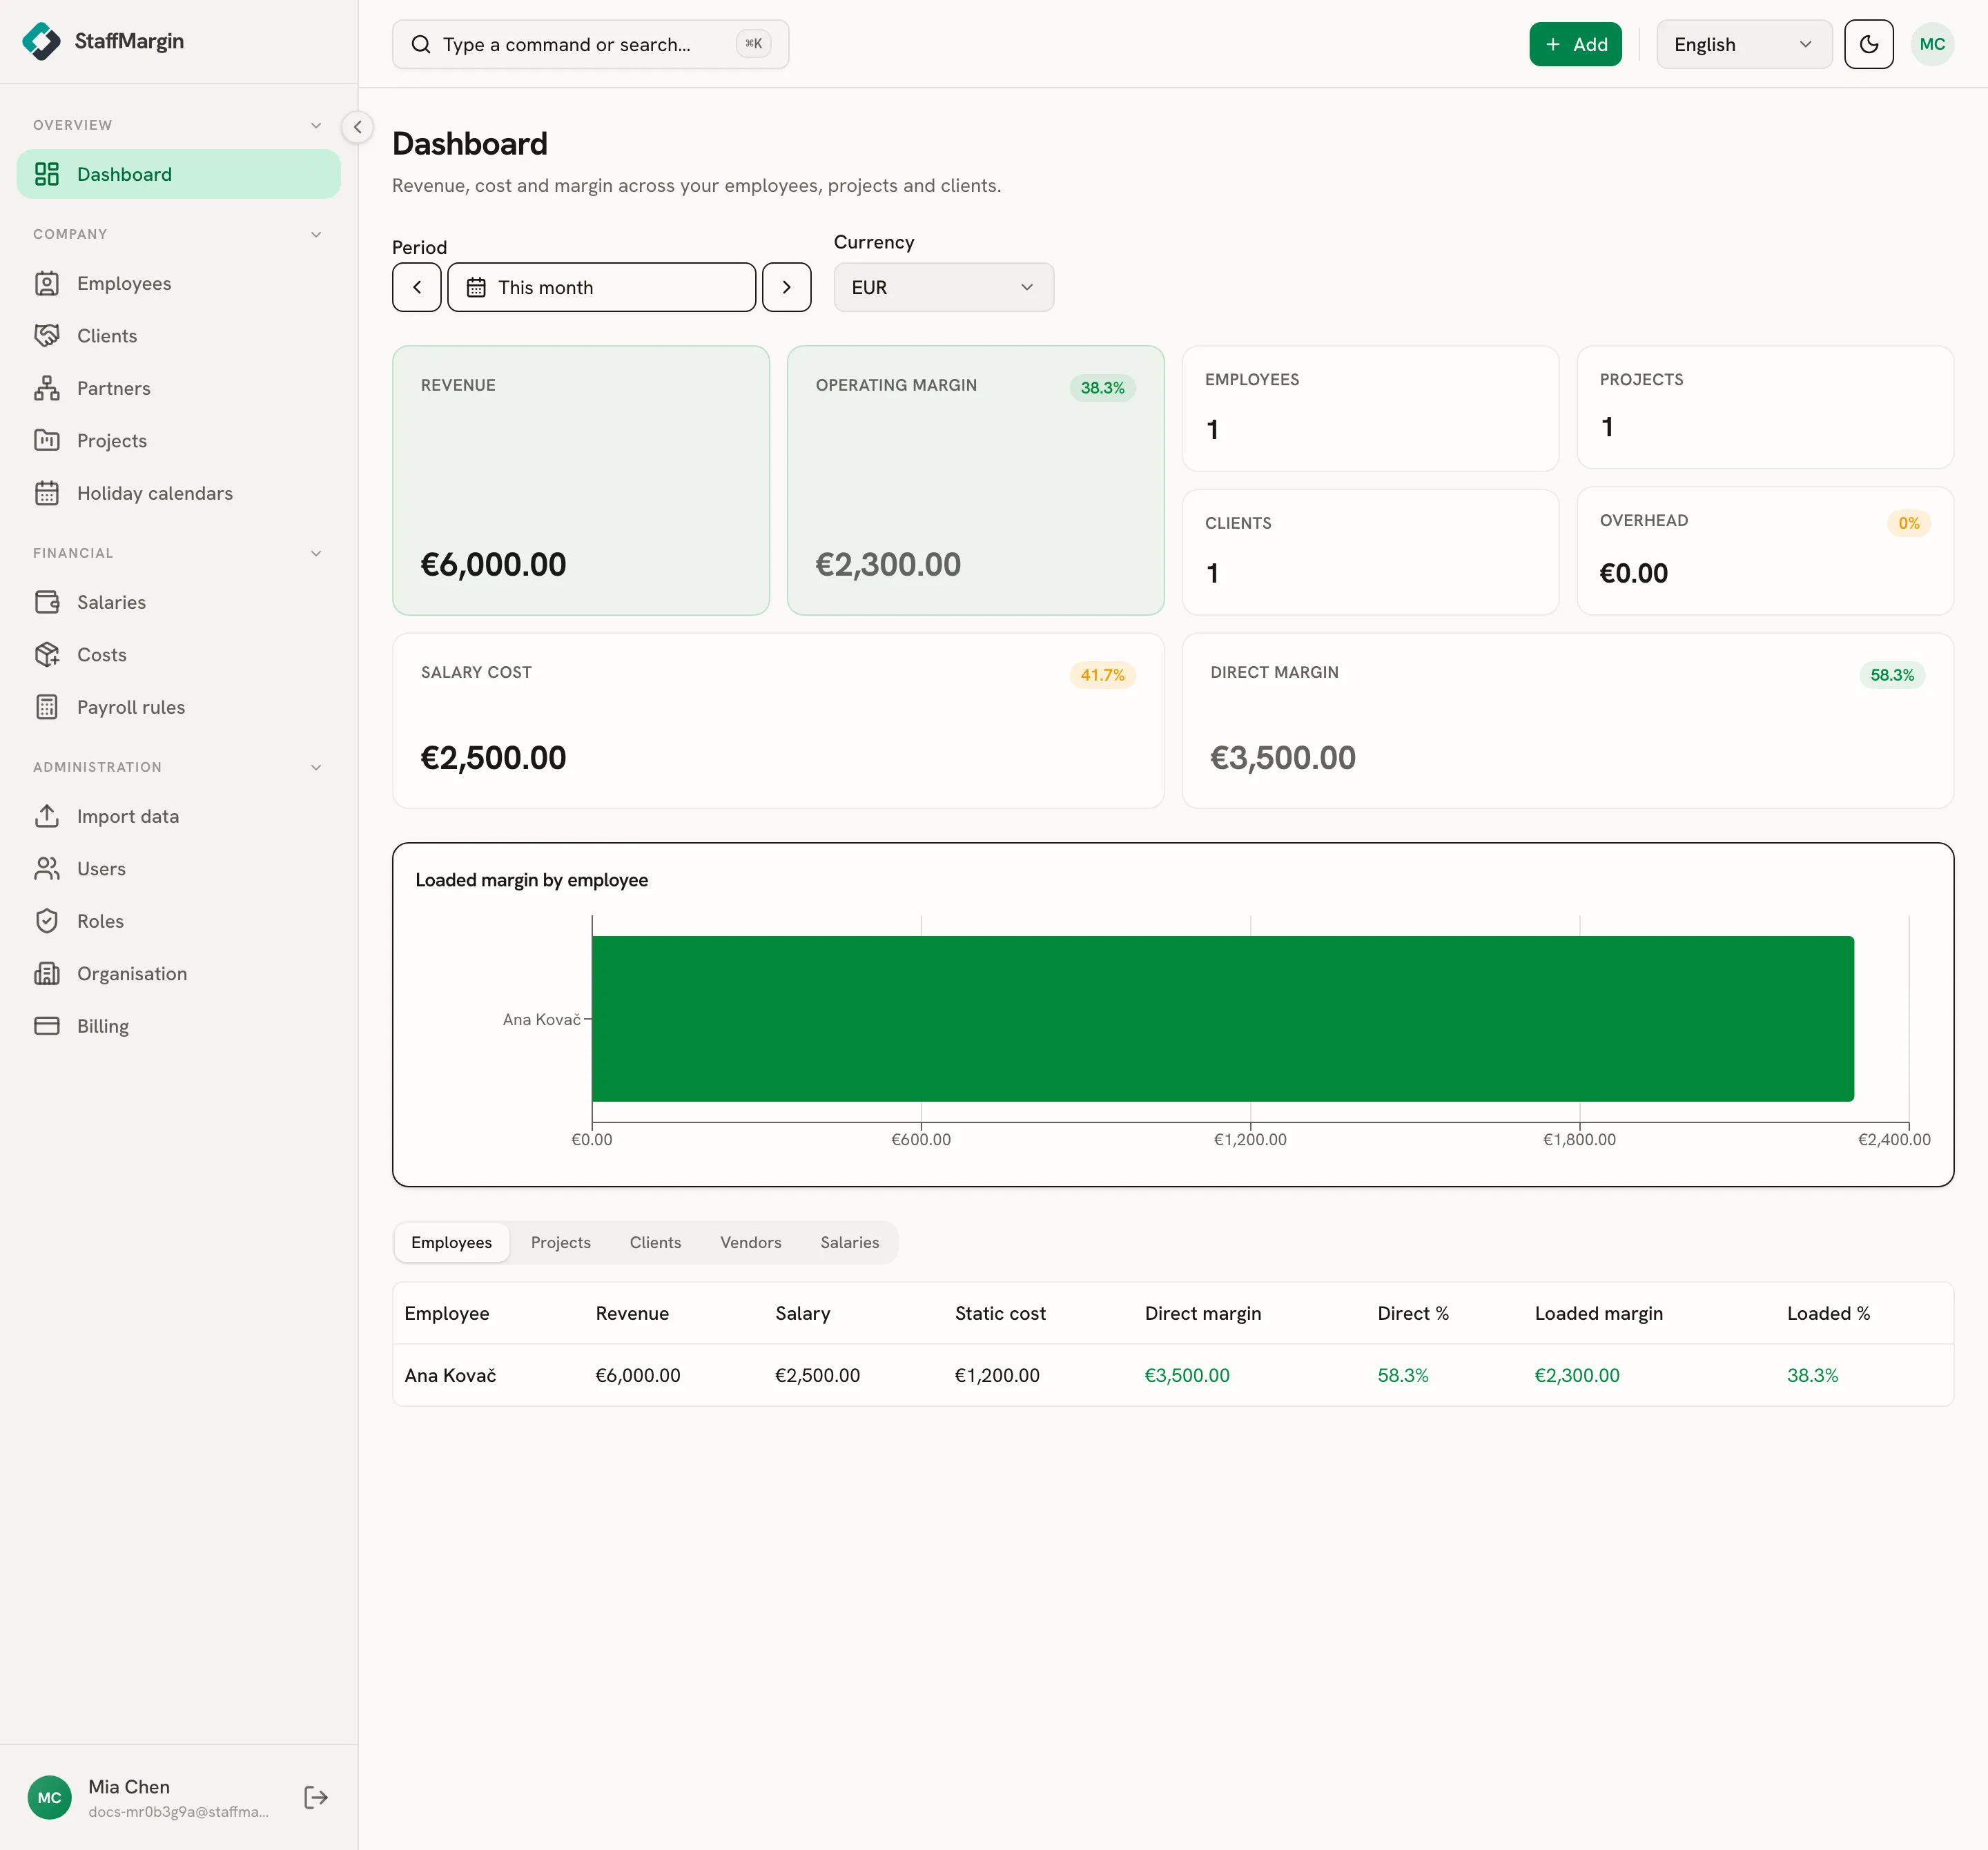
Section titled “What’s on the dashboard”Every field, at a glance.
- Period sets the date range every figure covers. It defaults to this month.
- Currency is the reporting currency. Every amount on the page converts to it.
- Revenue is what you billed in the period, from your project rates.
- Operating margin is the bottom line: revenue minus all loaded cost and overhead, with its margin percent.
- Counts show how many employees, clients, and projects fall in the period (the three small cards).
- Overhead is the cost you did not allocate to anyone, carried as company overhead.
- Salary cost is the loaded employer cost of salaries, with its share of revenue.
- Direct margin is revenue minus salary cost, before any other cost.
- Loaded margin by employee charts each person’s margin after their salary and allocated costs.
- View switcher flips the breakdown between employees, projects, clients, vendors, and salaries.
Set the period and currency
Section titled “Set the period and currency”The two controls at the top decide what the numbers mean.
Period filters every figure to a date range. Use the arrows to step month by month. A figure only counts if it falls inside the range.
Currency is the one currency the whole dashboard reports in. Employees, clients, and partners can each be billed and paid in different currencies, and StaffMargin converts them all into this one using stored historical rates, so a past month always reads the same. See multi-currency and historical rates.
Read the margin numbers
Section titled “Read the margin numbers”The cards build up from revenue to your bottom line. Each subtraction is one step.
Revenue
Section titled “Revenue”What you billed clients in the period, from each assignment’s rate. It is the top of every margin.
Salary cost
Section titled “Salary cost”The fully loaded employer cost of your people: salary plus the employer taxes and contributions for each country, set by their payroll rule. The card also shows salary cost as a share of revenue.
Direct margin
Section titled “Direct margin”Revenue minus salary cost. This is your margin on people before any other cost, with its percent of revenue.
Revenue − salary cost = direct margin
Overhead
Section titled “Overhead”Costs you did not allocate to anyone sit here as company overhead. Allocate a cost to people and it leaves overhead and lowers their margin instead. See costs.
Operating margin
Section titled “Operating margin”Your company bottom line for the period: direct margin, minus the costs you allocated to people, minus overhead. It is operating profit before tax and interest, and it can go negative when overhead outweighs delivery.
Direct margin − allocated costs − overhead = operating margin
A margin number turns red when it is negative, the same convention as a ledger.
Counts and margin by employee
Section titled “Counts and margin by employee”The three small count cards tell you how many employees, clients, and projects the period covers, so you can sanity-check the totals.
The Loaded margin by employee chart ranks each person by the margin they bring in after their salary and their allocated share of costs. Click any bar or row to open that person’s full breakdown.
Switch the view
Section titled “Switch the view”Below the chart, the view switcher changes the breakdown without changing the period or currency. Move between employees, projects, clients, vendors, and salaries to see the same money from each angle. Click a row to drill into the detail behind it.
Related
Section titled “Related”- How margin is calculated
- Employer cost and the salary engine
- Multi-currency and historical rates
- Salaries
- Costs
- Employees